
Sales management has gained importance to meet increasing competition and the need for improved methods of distribution to reduce cost and to increase profits. Sales management today is the most important function in a commercial and business enterprise.Find for me Sales-trend -> month wise , year wise , yearly_month wise
1. Excel
2. Power BI
-
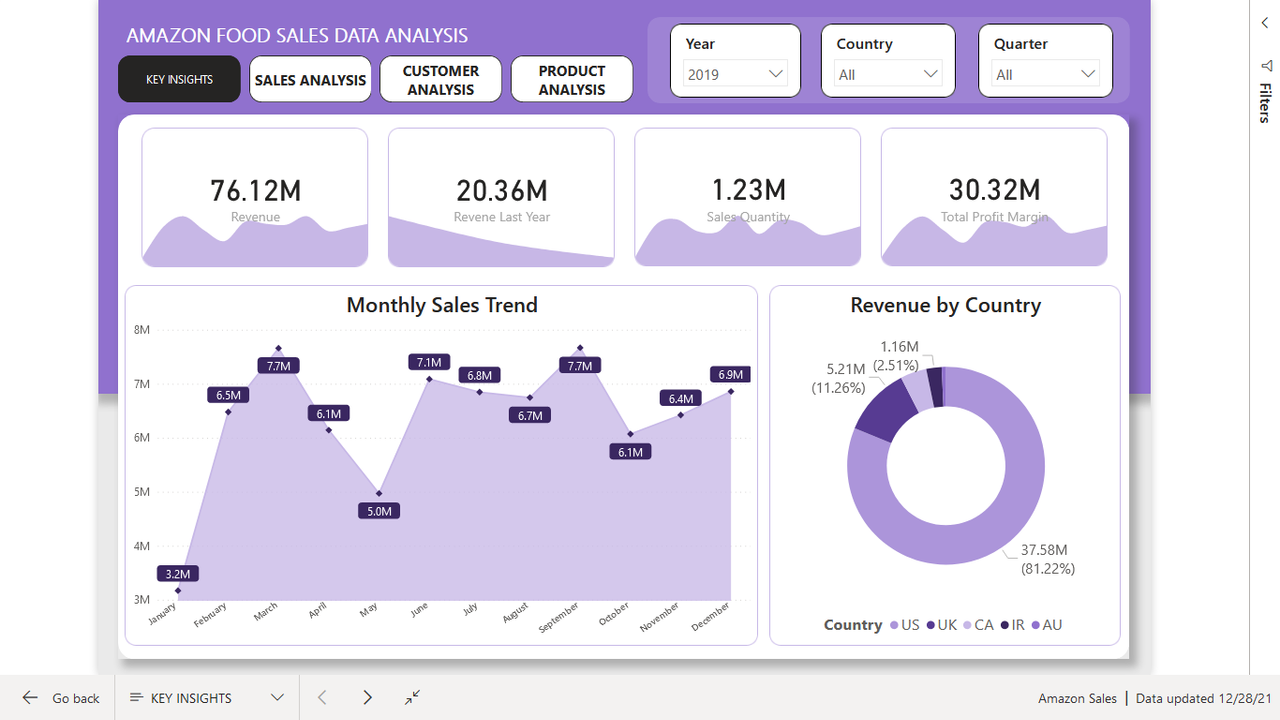
2017 had the highest Revenue at 85.12M, followed by 2019 at 76.12 and 2018 at 20.36M
-
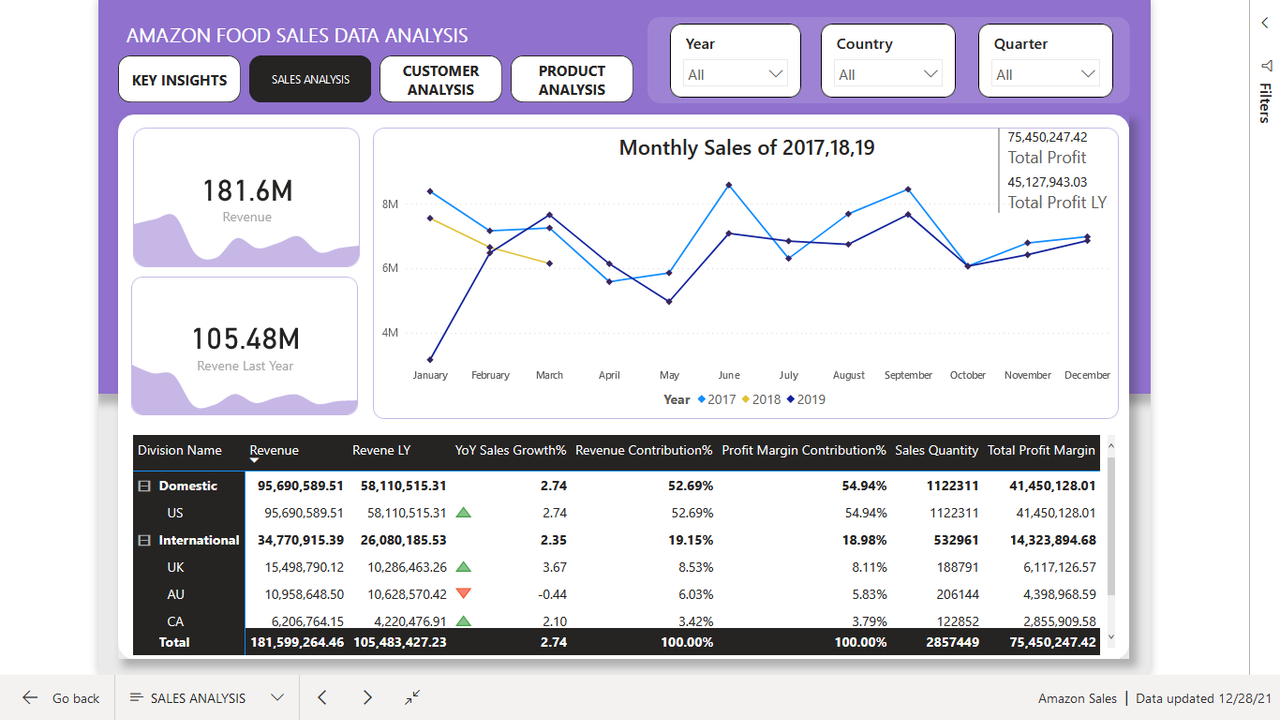
If we observe the monthly insights of 2017,2018,2019, the sales are at their peak in March, June, and September and are low in April, May & October. Amazon can come up with some good discounts and offers to generate high revenue.
-
The sales for the US are highest among all countries and lowest in Iran (IR).
-
The Better Large Canned Shrimp & High Top Dried Mushrooms are the highest selling products in domestic and international markets.
-
Paracel Gigaplace & Pereras are the top customers who generated the highest revenue
If you have any feedback, please reach out to me at Linkedin